Seamlessly integrate data from your HR and applicant-tracking systems into visually stunning, customized org charts. Our easy-to-use solution simplifies the complexity of HR work, providing unparalleled visibility into your organization’s personnel, and surfacing valuable insights for strategic decisions about future organizational structures.
Visualize your organization, gain talent insights, and facilitate workforce planning like never before.
We know HR professionals need to understand, manage, explain, and influence their organizations as they function in the here and now, while also evaluating how they should look and evolve in the future. Here’s how OrgChart helps you view the world through both time horizons.
HR professionals must provide detailed visibility into and across the people, departments, divisions, and locations that make up their organizations. You shine in your role when you show the organization in a visually engaging, accessible, and exciting way. We believe charting — that integral and endlessly challenging part of pursuing your passion for people — should be enjoyable. Shouldn’t it be easy to:
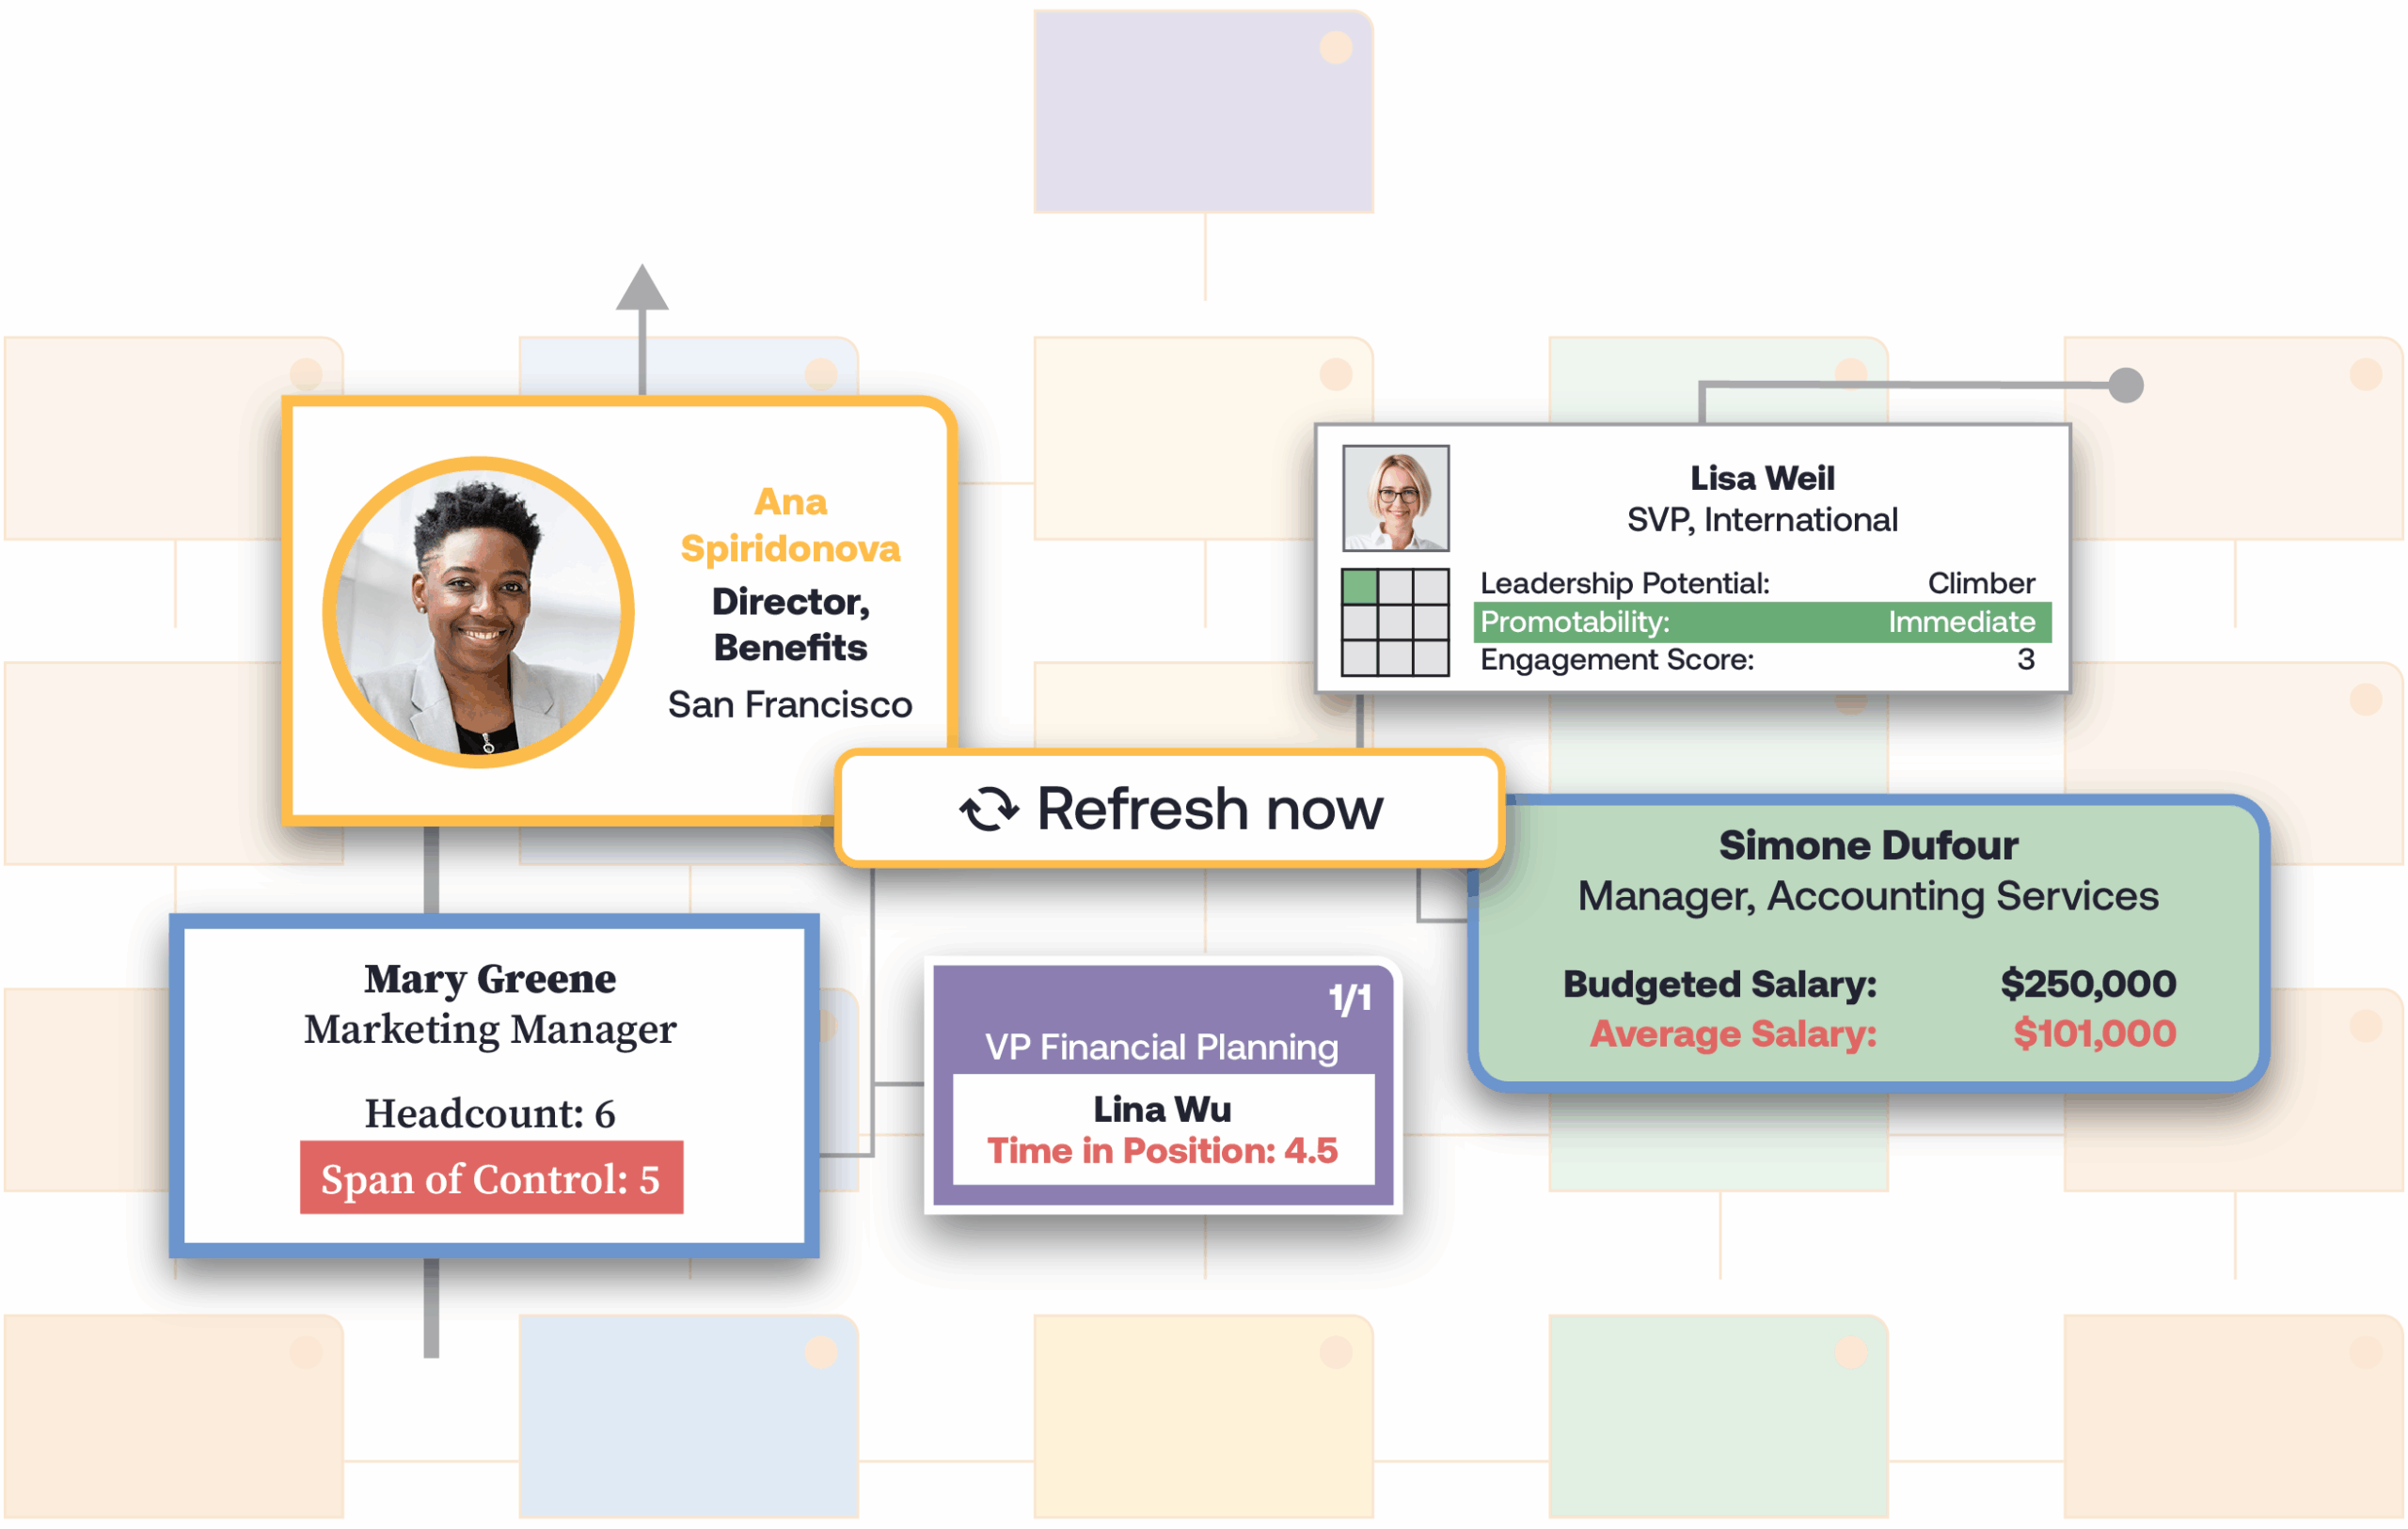
HR professionals must help their organizations make sense out of complex people data. OrgChart surfaces the insights you need to drive business conversations across multiple topics, providing customized views of your workforce that help the organization make sound decisions.
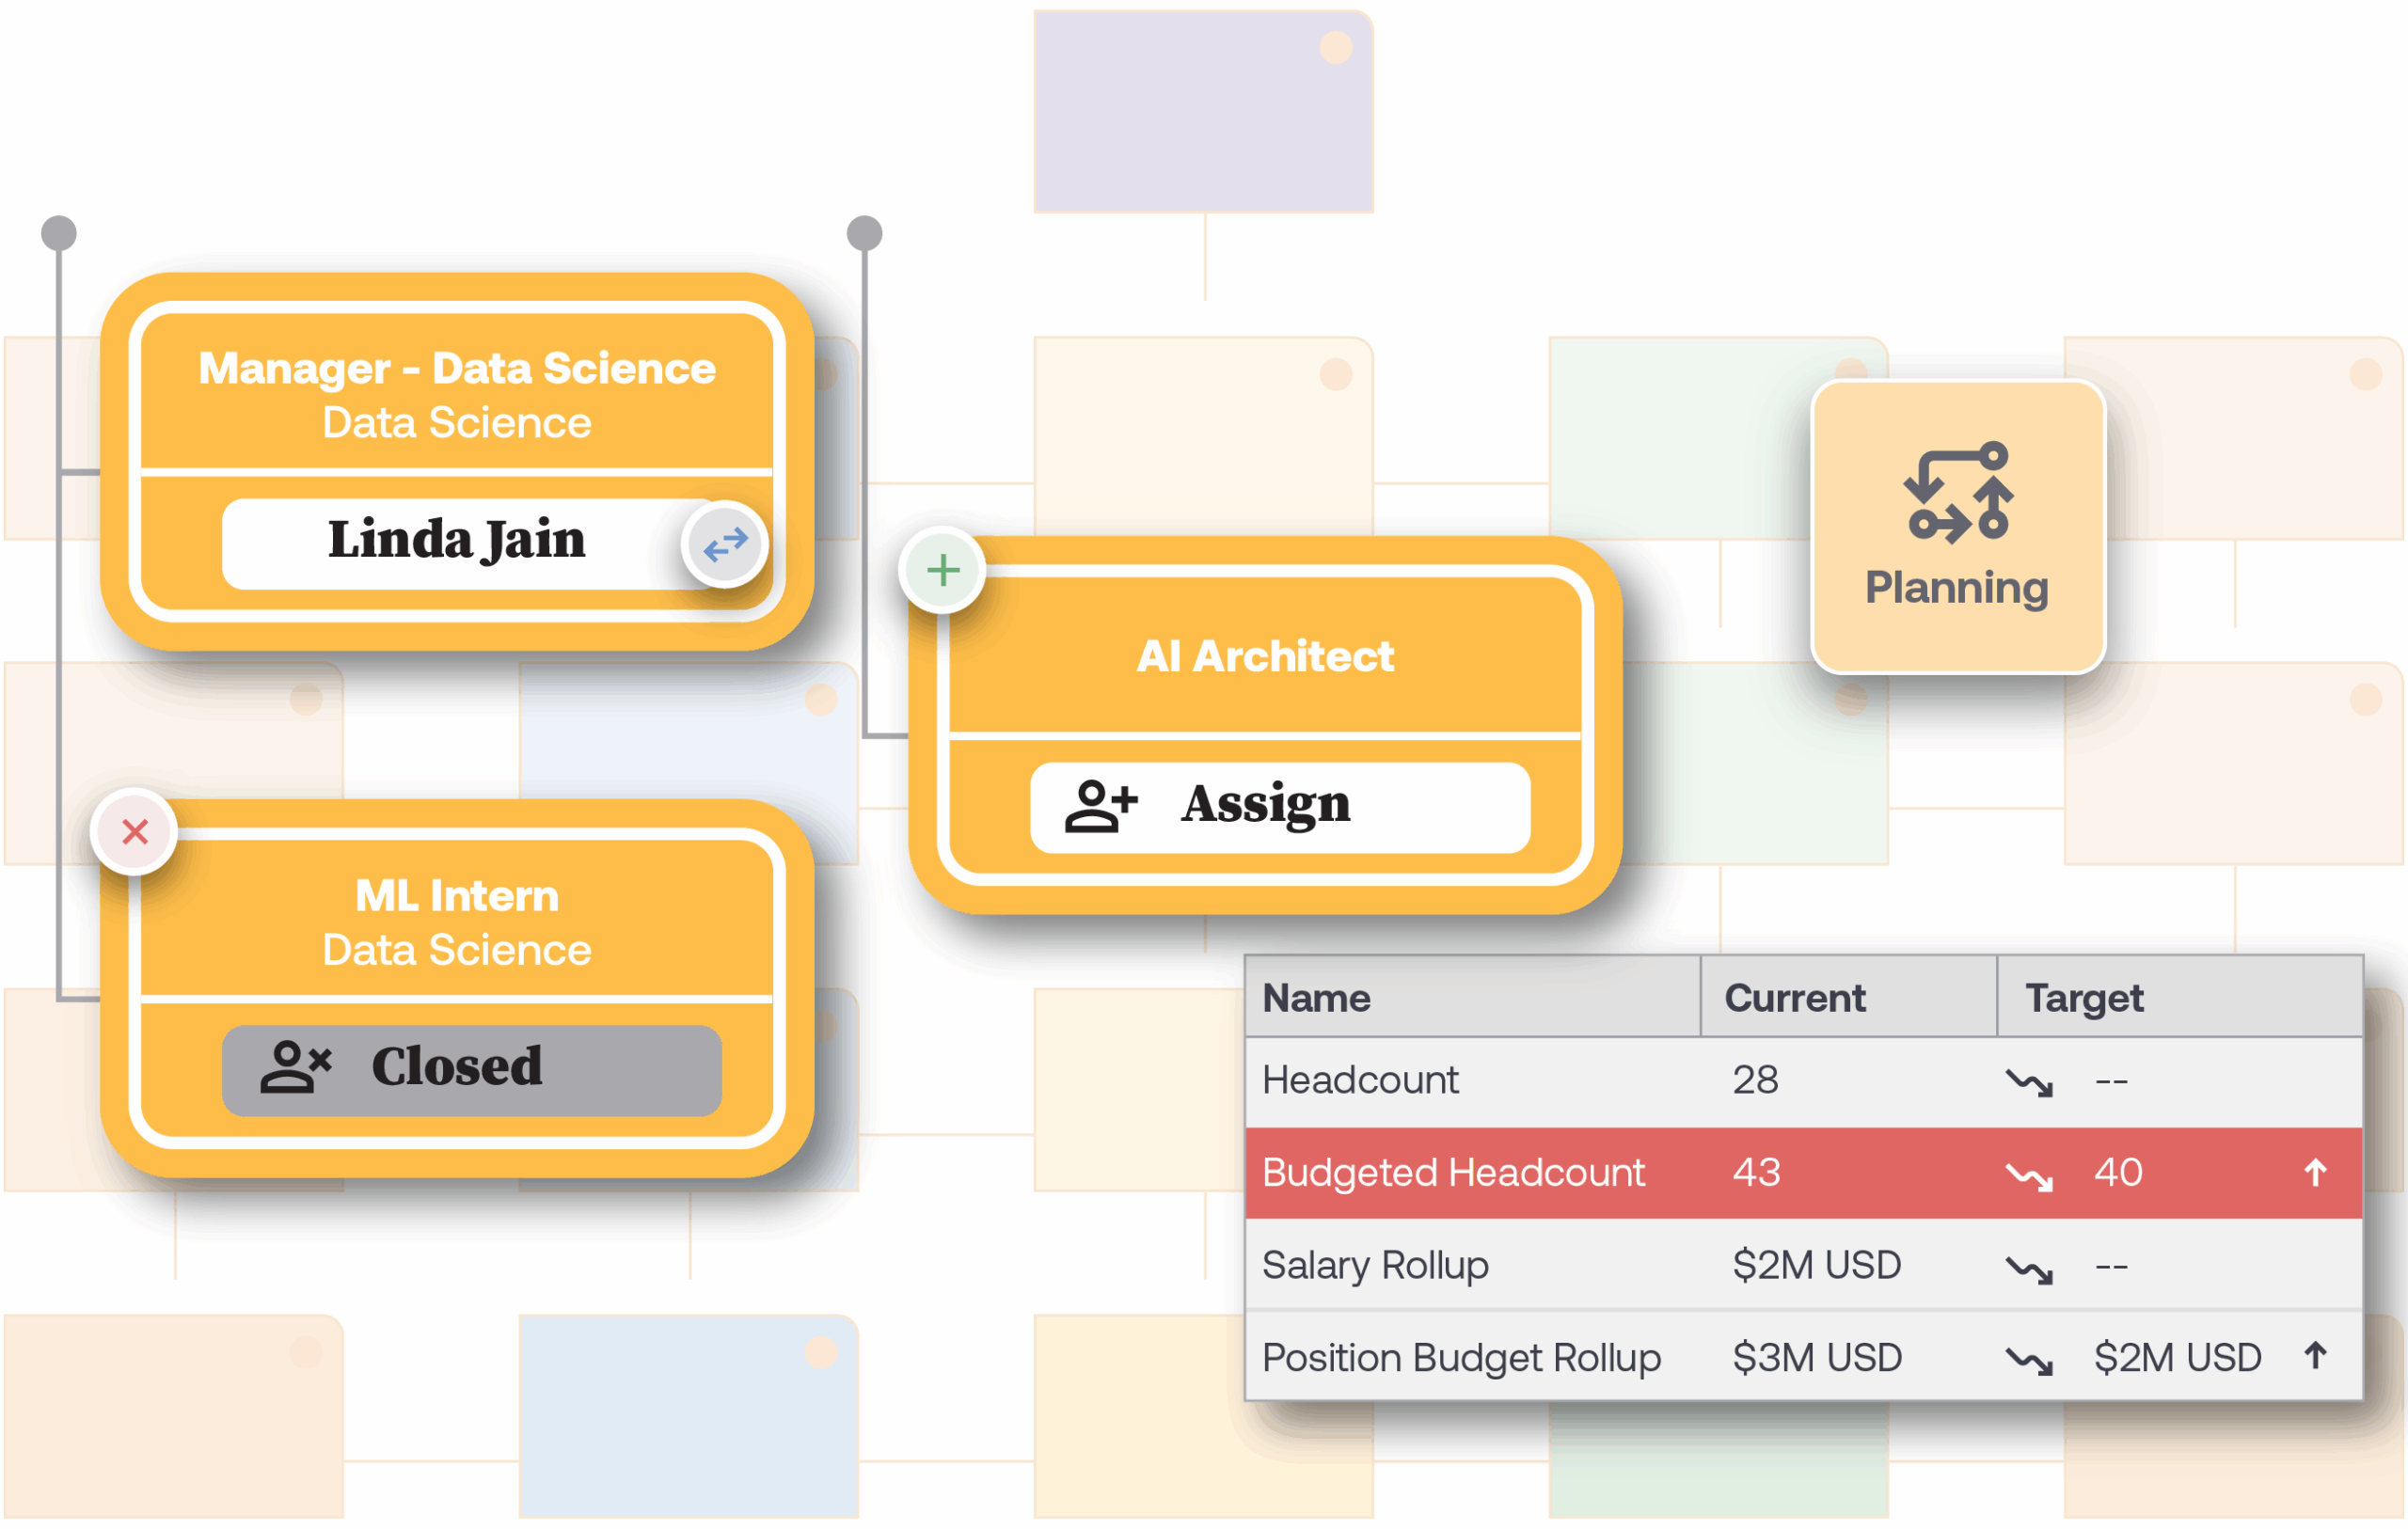
Planning is no easy task given the constantly shifting policy, regulatory, and competitive environments. OrgChart shows you the organization’s current state, then helps you explore the impact of possible scenarios, ultimately focusing your vision of the future.
Explore some of the many ways OrgChart can help meet your needs:
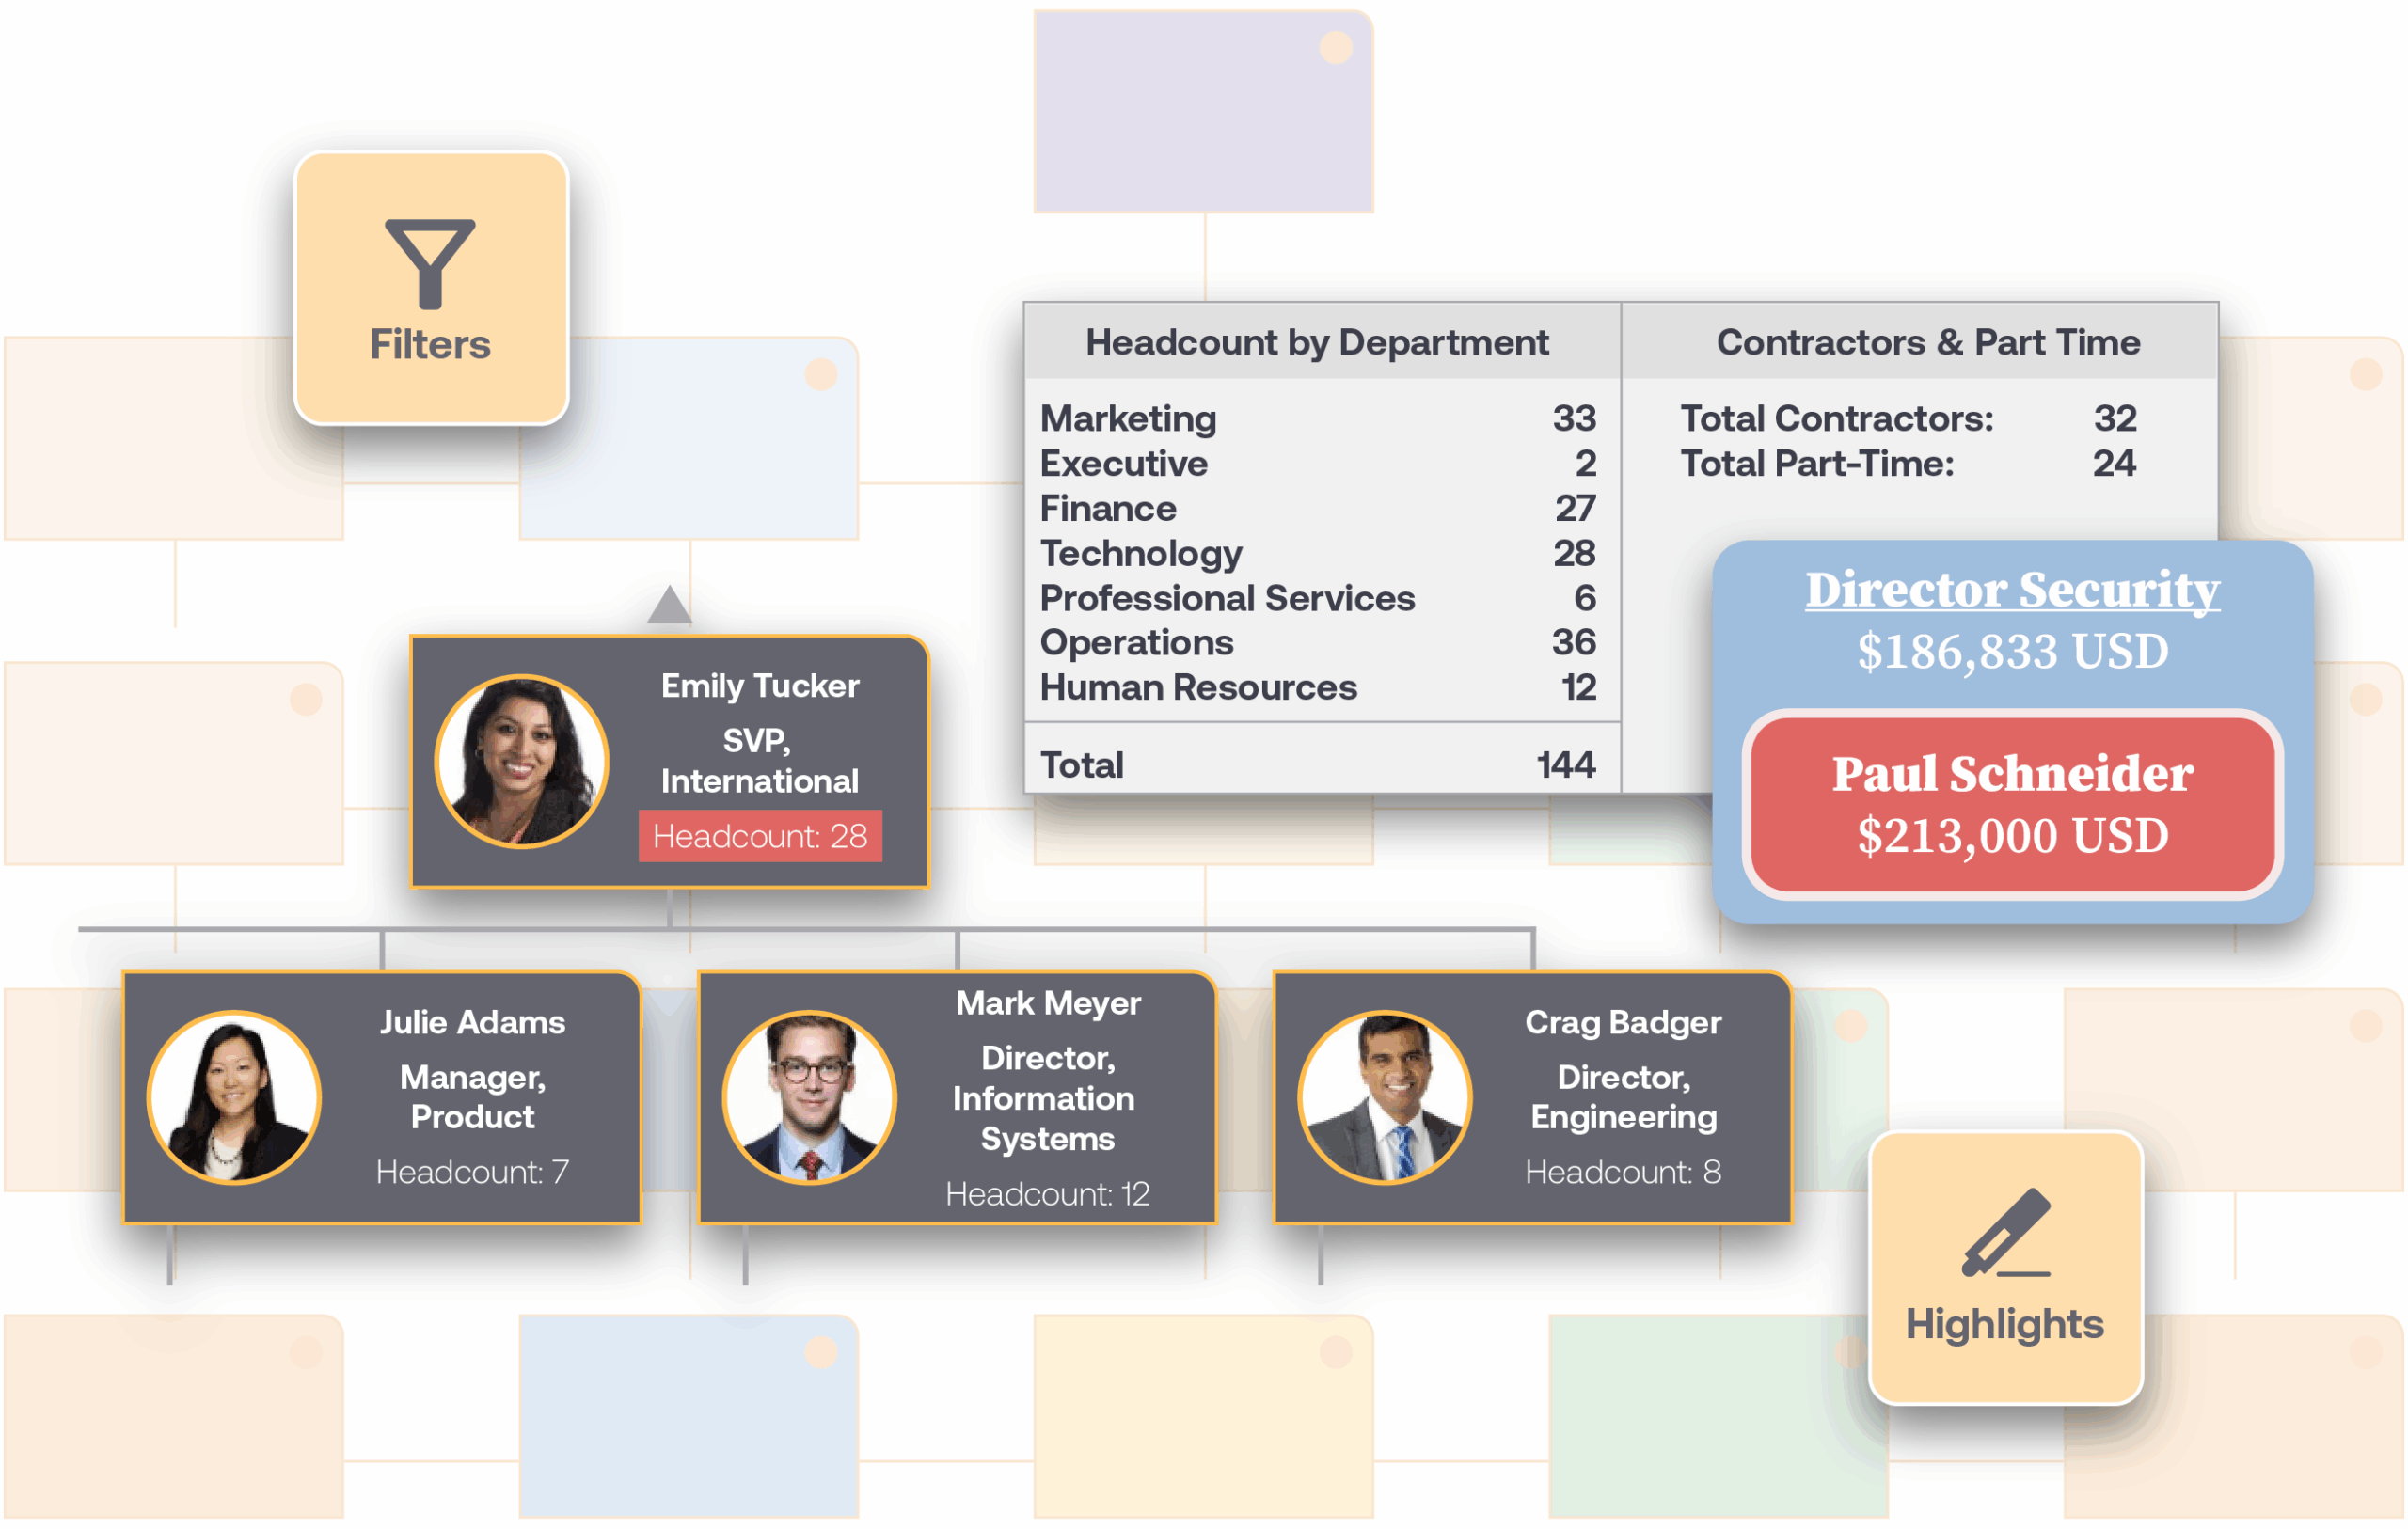
I need a chart that filters out specific employee types
OrgChart allows you to filter records by any data field, so that you only see the records that you want. You can filter records at any time, or create charts that don’t include certain records based on your defined criteria.
I need to see all of my employees who work remotely
OrgChart’s multiple filtering options allow you to control which records you see at any time. You can also create custom Views that highlight or mark employee records that match specific criteria. For example, you can give remote employees a red flag, or color all employees at a certain location blue.
I need to know how many open/vacant positions we have
You can integrate OrgChart with your Applicant Tracking System, so that can display your open/vacant positions on your chart. OrgChart also allows you to create custom formulas, so that you can keep track of the metrics you care about.
I need to know the average span of control for each manager
OrgChart allows you to create custom formulas using any field in your dataset. You also have complete control over the parameters and scope of your formulas, so that you can tailor your metrics to your needs.
I need to show employees that report to more than one manager
OrgChart allows you to map employee records to more than one manager, even if your HR system doesn’t. OrgChart also automatically accounts for these employees in headcount formulas, so that your rollups remain accurate.
I need to see the position structure of my organization
OrgChart can map positional data from your core HR system, or synthesize it, so that you can always visualize the positions structure of your organization. OrgChart also allows you to control the presentation of boxes on your chart, so if you don’t want to synthesize positional data, you can always produce an OrgChart with just tiles.
I need to see an org chart for each functional area
OrgChart Functional Charts can be created using any field in your dataset. When enabled, a placeholder is created for each functional area, and employees belonging to that function automatically rollup beneath it. This is a great way to visualize the functional structure of your organization, without having to make any manual edits to do so.
I need DEI charts for each department
OrgChart allows you to create custom formulas using any field in your dataset. For example, you can create and display formulas that calculate the gender percentage breakdown for each department. When it comes down to sharing these more sensitive charts, OrgChart allows you to control who can and can’t have access.
I need to know how much headcount I can afford to add at a certain location
The Planning module allows users to create custom metrics, set plan targets, and measure progress towards those targets as you model changes. Users can also define reference tables and lookup formulas that allow OrgChart to handle mutliple variables while planning, so if job level and location influence a position cost, the proper calculations are made.
As the best-in-class org chart and workforce planning solution, OrgChart easily integrates with other applications in your unique technology ecosystem, allowing you to get the most out of your people data.