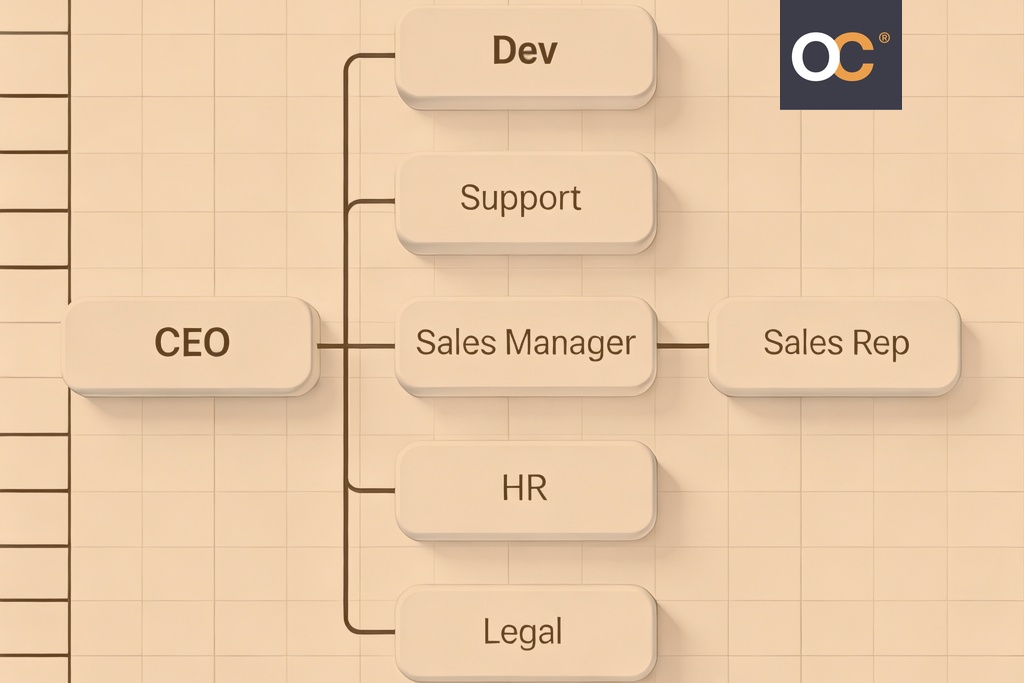
With hundreds of millions of users worldwide, Microsoft Excel is one of the most widely used tools in any workplace. So when it’s time to visualize reporting structures, it’s often the first place HR teams and managers look.
You can create an org chart in Excel using built-in features like SmartArt or manual shapes. For small teams and simple hierarchies, it works well. But as organizations grow and reporting lines shift, Excel’s limitations and manual approach become harder to work around.
This guide covers the best methods for creating an org chart in Excel, how to structure your data, and when it makes sense to move to a more scalable approach.
Quick start: If you just need the fastest path to a working org chart, go to Insert > SmartArt > Hierarchy > Organization Chart in Excel, enter names and titles, and use the Add Shape dropdown to build out your hierarchy.
Table of contents
- Can You Create an Org Chart in Excel?
- Ways to Create an Org Chart in Excel
- How to Make an Org Chart in Excel Using SmartArt
- How to Build an Org Chart in Excel Manually
- How to Structure Your Excel Data for Org Charts
- Limitations of Creating an Org Chart in Excel
- When Should You Use Excel for Org Charts?
- When Excel Is No Longer Enough
- How to Build Org Charts Automatically from Excel Data
Can You Create an Org Chart in Excel?
Yes, you can create an org chart in Excel using built-in tools like SmartArt or by manually organizing shapes into a hierarchy. However, Excel org charts require manual updates and can become difficult to manage as your organization grows.
Ways to Create an Org Chart in Excel
There are three primary approaches to building an org chart in Excel. Each serves a different use case, and understanding the tradeoffs will help you choose the right one.
| Method | Best For | Setup Time | Flexibility |
|---|---|---|---|
| SmartArt | Quick charts for small teams | Minutes | Limited |
| Manual Shapes | Custom layouts and non-standard hierarchies | Moderate | High |
| Data-Based Setup | Preparing for automation or future scaling | Moderate | Foundational |
SmartArt is the fastest option. Excel’s built-in hierarchy templates let you generate a formatted org chart in minutes. For teams of 20 or fewer employees and straightforward reporting lines, it’s the most practical starting point.
Manual shapes offer more control. By inserting and arranging individual shapes, you can accommodate structures that SmartArt doesn’t support well, such as matrix reporting, dotted-line relationships, or cross-functional teams. The tradeoff is time: every element must be placed, connected, and formatted by hand.
Data-based setup takes a different approach. Instead of drawing the chart directly, you organize your employee data in a structured spreadsheet, with columns for name, title, and reporting manager. Excel alone can’t convert this into a visual chart automatically, but this format becomes essential if you later move to a dedicated org chart builder or need to import your data into visualization tools.
How to Make an Org Chart in Excel Using SmartArt
SmartArt is built into every modern version of Excel (2007 and later, including Microsoft 365) and provides the most direct path to a working org chart. Here’s how to create one.
Step 1: Open Excel and go to the Insert tab. In the ribbon, navigate to the Insert tab and locate the Illustrations group.
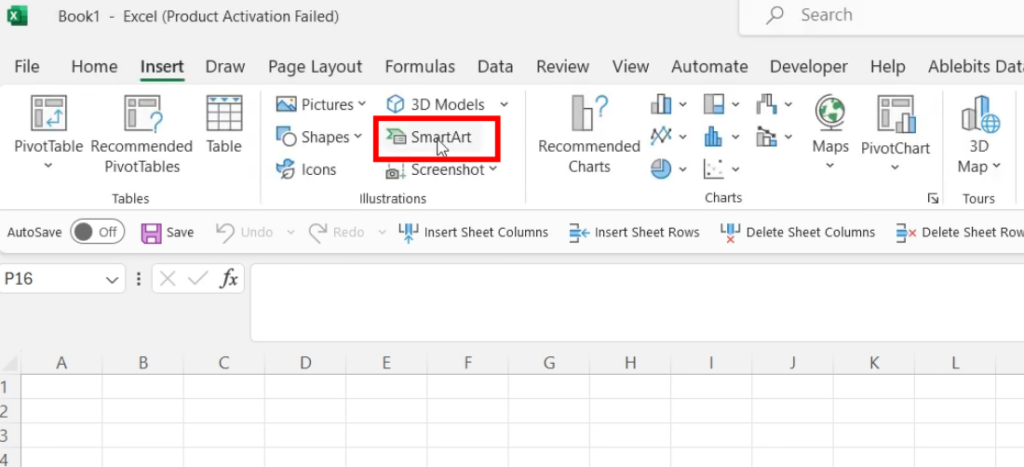
Step 2: Click SmartArt. A dialog box will appear with a variety of graphic categories on the left panel.
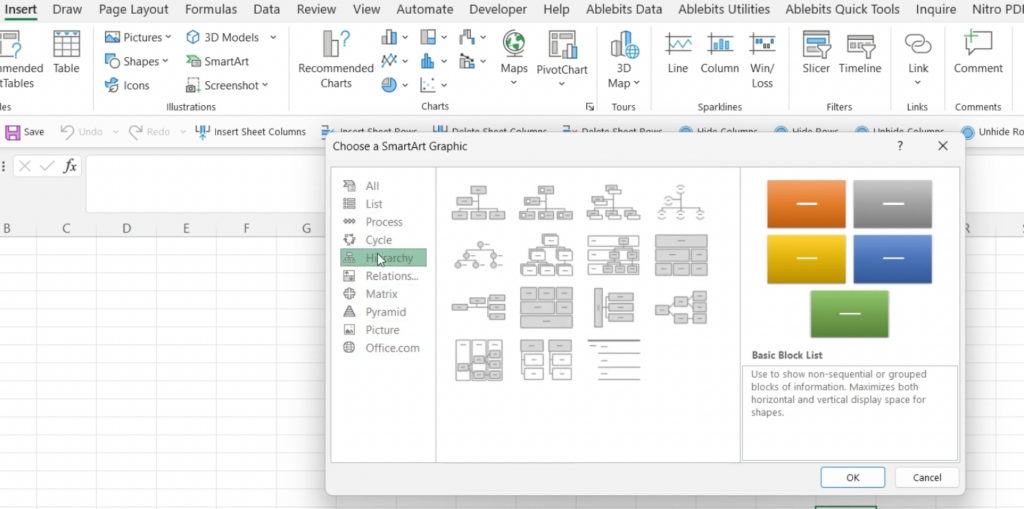
Step 3: Select Hierarchy, then choose Organization Chart. This template provides a pre-built hierarchical structure with a top-level box and branching subordinates. Click OK to insert it into your worksheet.
Step 4: Enter employee names and roles. Click directly into each text box and type the employee’s name and title. Start with the highest-level position and work downward through the hierarchy.
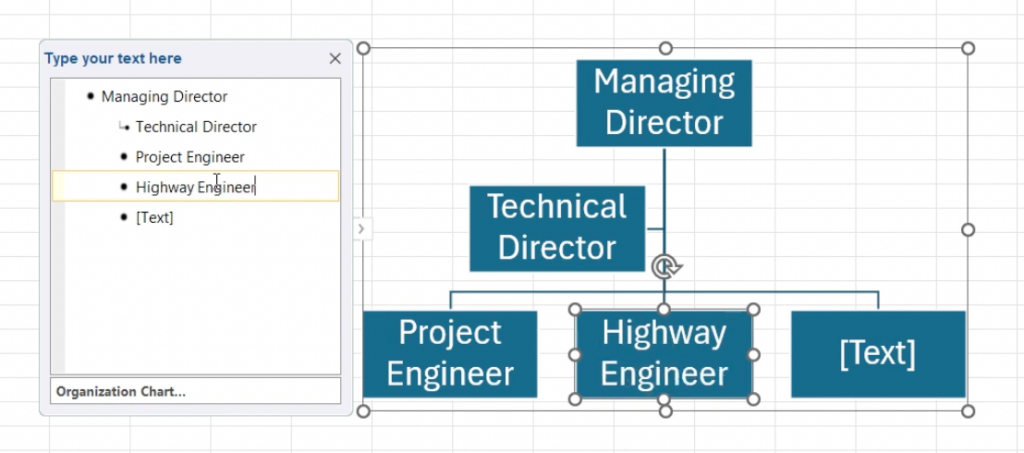
Step 5: Add shapes for additional employees. Select an existing shape, then use the Add Shape dropdown in the SmartArt Design tab. You can add shapes above, below, or at the same level as the selected position. Use Add Assistant for roles that report directly to a position but sit outside the main hierarchy line, such as an executive assistant or chief of staff.
Step 6: Format colors, layout, and structure. The SmartArt Design tab offers preset color schemes and style options. Use the Layout dropdown to switch between different hierarchy views: the Standard layout works for most organizations, while the Both hanging layout distributes direct reports evenly on either side of a manager’s box. The Format tab allows for more granular control over individual shape fills, borders, and text formatting.
Tips for Using SmartArt Effectively
Consistent naming conventions improve readability. If one position uses “VP of Marketing,” every position at that level should follow the same pattern, not “Marketing VP” or “Head of Marketing.” Consistency across titles signals a well-organized chart and makes it easier for viewers to understand relative seniority.
Each level of the hierarchy should contain a manageable number of positions. When a single tier becomes too crowded, the chart compresses text and reduces visual clarity. For managers with a wide span of control, consider grouping direct reports by function or team to keep the chart readable.
SmartArt’s layout options can also help with readability. For organizations with many peer-level positions, switching to a horizontal layout prevents the chart from becoming excessively tall and narrow.
How to Build an Org Chart in Excel Manually
When SmartArt’s templates don’t fit your organizational structure, building a chart manually with shapes offers full design control.
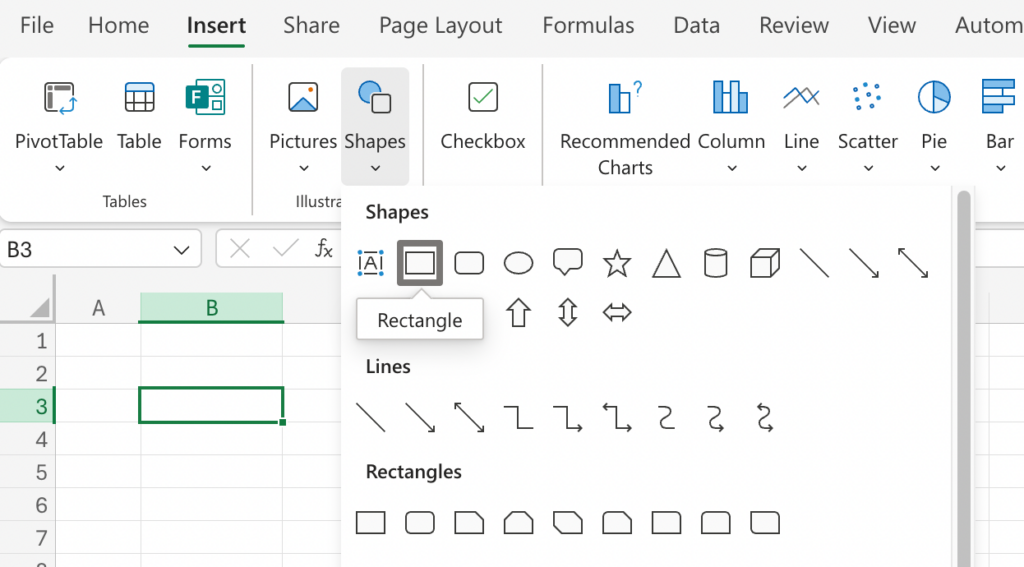
Step 1: Insert shapes for each employee. Navigate to Insert > Shapes and select a rectangle or rounded rectangle. Draw one shape for each position you need to represent. Keeping shape sizes uniform, roughly 1.5 inches wide by 0.75 inches tall, creates a cleaner, more professional result.
Step 2: Arrange shapes in hierarchical order. Position the top-level role at the top of the worksheet. Place direct reports on the next row down, their reports on the row below that, and so on. Use Excel’s grid and alignment guides (View > Gridlines and View > Snap to Grid) to keep spacing even.
Step 3: Connect shapes using lines or arrows. Return to Insert > Shapes and select a straight line or elbow connector. Draw lines from each manager’s shape down to their direct reports. Elbow connectors work best for org charts because they route cleanly around other shapes.
Step 4: Add names and job titles. Double-click each shape to open the text editor. Type the employee’s name and title. Adjust font size so text fits without crowding the borders, 10pt or 11pt typically works well for standard shapes.
Step 5: Format for readability. Assign consistent fill colors by department (for example, blue for Engineering, green for Marketing, orange for Operations) to make the chart scannable at a glance. Group related shapes (select all, then right-click > Group) so they move together if the layout needs adjustment. Add a simple legend if color-coding is used.
When to Use the Manual Method
The manual approach is most practical when you need to represent structures that don’t follow a standard top-down hierarchy. Matrix organizations, dual-reporting lines, and cross-functional HR structures are common scenarios where SmartArt’s rigid templates fall short.
It’s also the right choice when visual design matters, for instance, when preparing a chart for an executive presentation or board meeting where branding and layout quality need to be precise.
The tradeoff is maintenance. Every organizational change requires manually repositioning shapes, redrawing connectors, and re-checking alignment. For static, one-time use cases, that’s acceptable. For charts that need regular updates, it quickly becomes impractical.
How to Structure Your Excel Data for Org Charts
No matter which method you use to build your chart, setting up your employee data in a clean, consistent spreadsheet makes everything easier, both now and if you ever need to scale up later.
At a minimum, your spreadsheet should include three core columns:
| Employee Name | Job Title | Reports To |
| Sarah Chen | CEO | — |
| James Park | VP of Engineering | Sarah Chen |
| Maria Lopez | VP of Marketing | Sarah Chen |
| Robert Taylor | VP of Operations | Sarah Chen |
| David Kim | Senior Developer | James Park |
| Ana Patel | Marketing Manager | Maria Lopez |
| Raj Mehta | Junior Developer | David Kim |
| Lisa Nguyen | Content Specialist | Ana Patel |
Employee Name identifies each individual.
Job Title captures their role.
Reports To defines the direct manager, which is what establishes the hierarchical relationship.
For organizations that want to get more out of their data, adding columns for Employee ID, Department, Location, and Start Date provides additional dimensions for filtering, sorting, and analysis. This is especially valuable if you plan to use this data to build an org chart from Excel data automatically using a purpose-built tool.
A few best practices that will save time later: use a unique identifier (such as an employee ID) for each row to avoid confusion when multiple employees share a name. Spell manager names in the “Reports To” column exactly as they appear in the “Employee Name” column, even a small inconsistency (like “James Park” vs. “James S. Park”) will break any automated chart generation. And leave the “Reports To” field blank for the top-level position rather than entering “N/A” or “None.”
This structure mirrors the format used by most HRIS platforms and org chart tools, making the transition from Excel to a dedicated solution straightforward.
Limitations of Creating an Org Chart in Excel
Excel works well as a starting point, but it does have some practical limitations worth knowing about before you begin.
Every update is manual. When someone is promoted, a new hire joins, or a team is restructured, the chart must be rebuilt by hand. According to OrgChart’s State of HR Visibility and Insight report, based on a survey of more than 400 HR leaders, 50% of HR teams spend five or more hours each month keeping their org charts up to date. That’s time pulled directly from strategic work like workforce planning and organizational design.
Charts break as teams grow. A SmartArt chart that works cleanly for 15 people becomes cramped and unreadable at 50. Manual shapes become a layout puzzle at 100. Excel simply wasn’t designed to handle large, multi-layered organizational structures, and the visual output degrades as complexity increases.
There’s no syncing with employee data. Your HRIS contains the most current employee information, but Excel org charts exist separately. Any change in your HR system, like a title update, a reporting line shift, or a new hire, must be manually replicated in the chart. That makes it easy for the chart to fall out of date.
Version control is difficult. When multiple stakeholders work on different copies of the same chart, conflicting versions are almost inevitable. Excel offers no built-in mechanism to track changes, merge edits, or identify which version is current.
Collaboration is limited. Sharing a static Excel file is not the same as giving stakeholders access to a live, interactive view of the organization. The same OrgChart report found that 47% of HR leaders lack adequate visibility into their organizational structure, open positions, or both, and reliance on static, spreadsheet-based tools is a significant contributor.
These limitations don’t make Excel the wrong choice for every situation, but they’re worth keeping in mind as your organization evolves.
When Should You Use Excel for Org Charts?
Excel is a reasonable choice in specific scenarios, and recognizing them avoids overinvesting in tools before they’re needed.
Small teams (fewer than 20 employees). For organizations at this size, a SmartArt chart can be created and maintained without significant effort. Reporting lines are simple, changes are infrequent, and the chart remains readable.
One-time presentations. If the org chart is needed for a single board meeting, investor pitch, or onboarding packet and won’t need to be maintained afterward, Excel’s familiarity and accessibility make it a practical option.
Simple, single-layer hierarchies. When the reporting structure is straightforward, one executive team, a handful of department heads, and a small number of direct reports, the limitations described above are unlikely to cause problems.
In these cases, Excel’s biggest advantage is availability. Most professionals already have access to it and know how to use it. There’s no procurement process, no learning curve, and no setup time beyond opening a workbook.
When Excel Is No Longer Enough
For many organizations, the shift away from Excel happens gradually. Updates start taking longer, stakeholders begin questioning whether the chart is current, and maintenance starts competing with higher-priority work.
Here are a few common signs that it may be time to explore other options:
Headcount is growing. Once an organization exceeds a few dozen employees, the effort required to maintain an accurate Excel org chart increases faster than the headcount itself. The same OrgChart survey found that 88% of HR leaders face visibility and planning challenges, and static, spreadsheet-based tools are a contributor.
Organizational changes are frequent. Restructurings, promotions, lateral moves, and new hires are constants in growing companies. Research from Deloitte indicates that HR teams spend as much as 57% of their time on administrative tasks. Manually updating org charts after every change compounds that burden.
Decisions depend on real-time accuracy. When leadership needs a current, reliable view of the organization for headcount planning, merger integration, or succession management, a chart that lags days or weeks behind reality introduces risk. Static tools can’t deliver the accuracy that these decisions require.
Workforce planning is on the roadmap. Excel can show where things stand today, but it cannot model what the organization should look like in six months. For scenario planning, budget modeling, and strategic headcount decisions, organizations need workforce planning capabilities that connect the current structure to future goals.
How to Build Org Charts Automatically from Excel Data
If your employee data already lives in Excel, you’re closer to an automated org chart than you might think. Dedicated org chart tools can import that spreadsheet data and generate a visual hierarchy automatically, which means fewer manual updates and less time spent on layout.
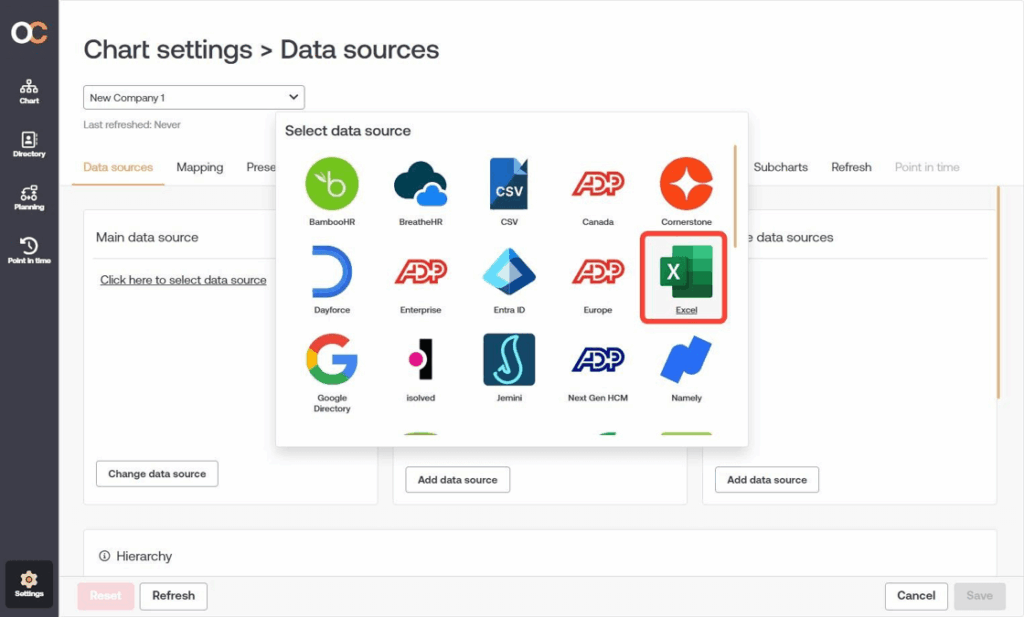
For example, OrgChart can connect directly to your existing Excel file, map fields like employee name, title, and reporting relationship, and generate a formatted chart in minutes. When you update the spreadsheet, the chart reflects those changes automatically.
The advantage of this approach is that Excel remains your data source. You just add the automation and layout flexibility that dedicated org chart software provides. That can include customizable layouts, shareable views, and the ability to layer in additional data like department, location, or span of control directly on the chart.
If you’re already managing employee data in a spreadsheet, this kind of automation is a natural next step once manual chart maintenance starts taking up more time than it should.
Instead of rebuilding charts manually, import Excel data into a dynamic org chart tool.
When you update your spreadsheet, the chart can update too, which removes much of the manual reformatting that makes Excel org charts hard to maintain over time.
If you want to see how this works in practice, explore how to build an org chart from Excel data automatically.
A Faster Way to Build Org Charts from Excel
Skip the manual updates. See how to turn Excel employee data into a dynamic org chart that is faster to build and easier to maintain.

FAQ
You can create an org chart in Excel using SmartArt or by manually arranging shapes into a hierarchy. SmartArt is the faster method. Navigate to Insert > SmartArt > Hierarchy, select the Organizational Chart template, and enter names and titles. The manual method uses individual shapes and connectors for full design control.
SmartArt’s hierarchy templates are the easiest option. They provide a pre-formatted structure that you can populate with employee information in minutes, without designing individual shapes, connectors, or layout elements from scratch.
No. Excel org charts do not update automatically. Every change to the organizational structure, new hires, promotions, and restructurings requires manual edits. For automatic updates, organizations use dedicated org chart tools that sync directly with their data source.
Excel works well for simple org charts involving small teams and straightforward hierarchies. It becomes increasingly difficult to manage as organizations grow, primarily because every change requires manual updates, and there is no connection to live employee data or HRIS systems.